Solar Power - Part 2
Time to install some solar panels!
Timeline
2013-05-03 Requested price quotes from several installers
2013-05-03 First phone and email contact with solar installers (CAM Solar)
2013-05-06 First installer to walk around on my roof and give suggestions (Longhorn Solar)
2013-05-07 Received first written price quote for solar system
2013-05-08 First survey and price quote for roof replacement
2013-05-09 Home Owners Association Approval
2013-05-10 Roof air vents removed, sewer vent rerouted to north surface
2013-05-11 Old roof removed and tar paper resurfaced
2013-05-12 New roof shingles installed (Day 1)
2013-05-13 New roof shingles installed (Day 2)
2013-05-14 Oak tree in the backyard cut down
2013-05-15 Oak trees in the front yard trimmed
2013-05-16 Signed contract with solar installer. Application documents sent to the power company.
2013-07-01 Power company finally approves solar application
2013-07-03 Received all solar panels, inverters, and racks. Racks mounted on the roof.
2013-07-04 Solar panels mounted on the roof
2013-07-09 Wires run and additional electrical boxes mounted to the wall
2013-07-30 Utility company swaps the old meter with the new PV meter and turns the system on! Internet monitoring system setup.
Overview
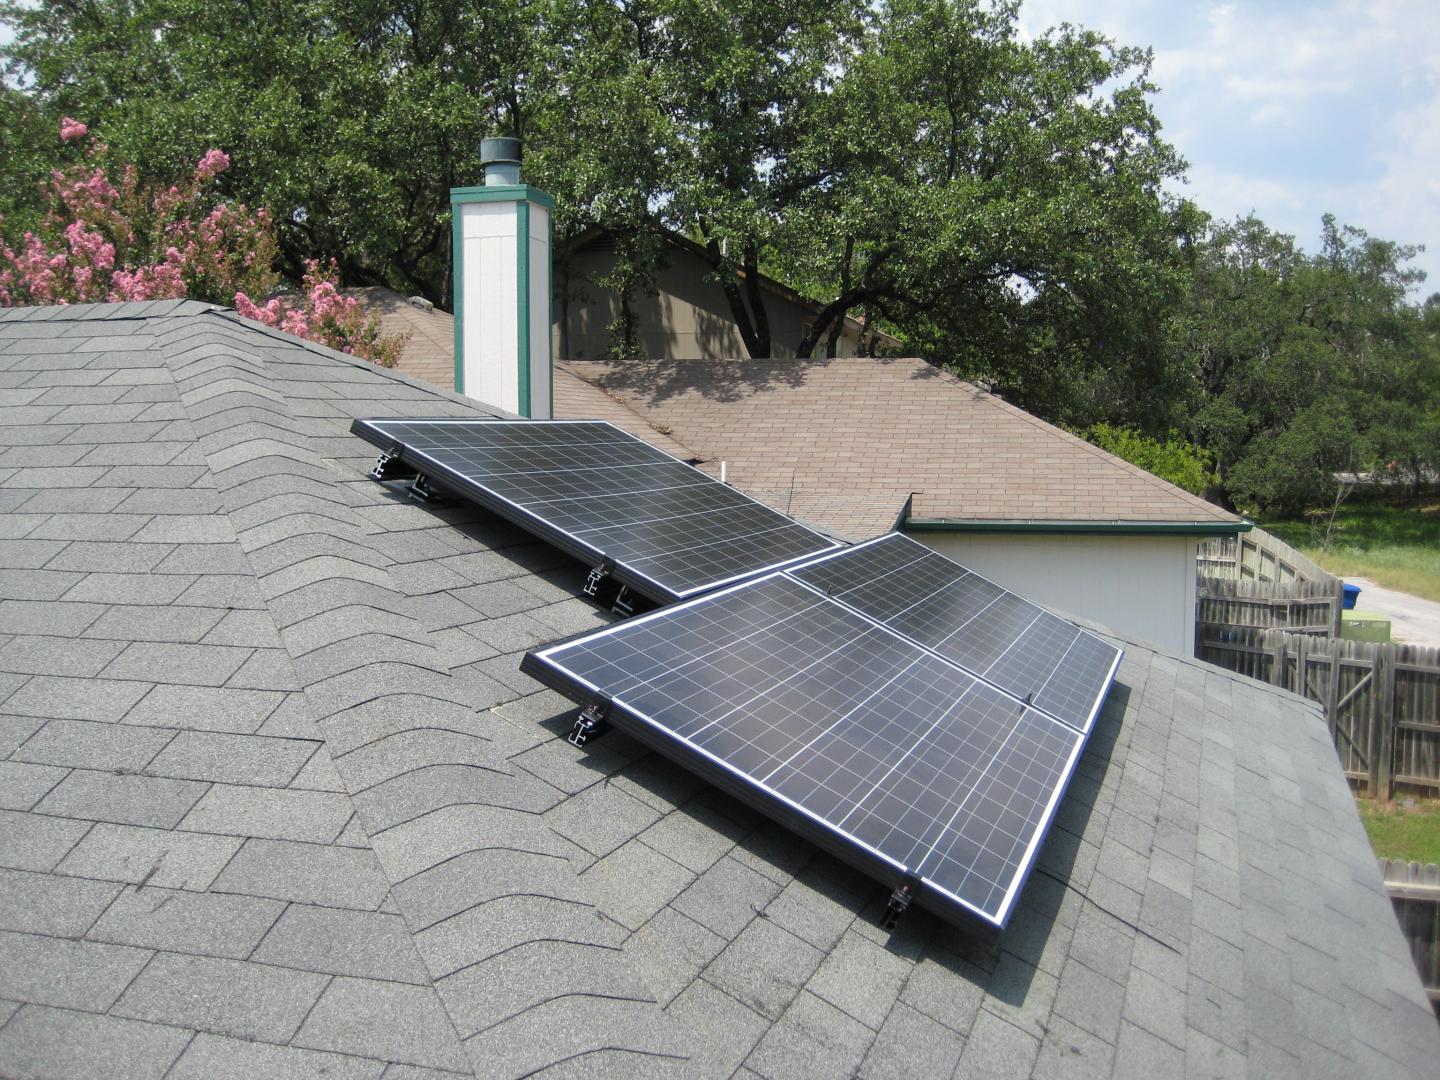
All 29 panels in a stack.
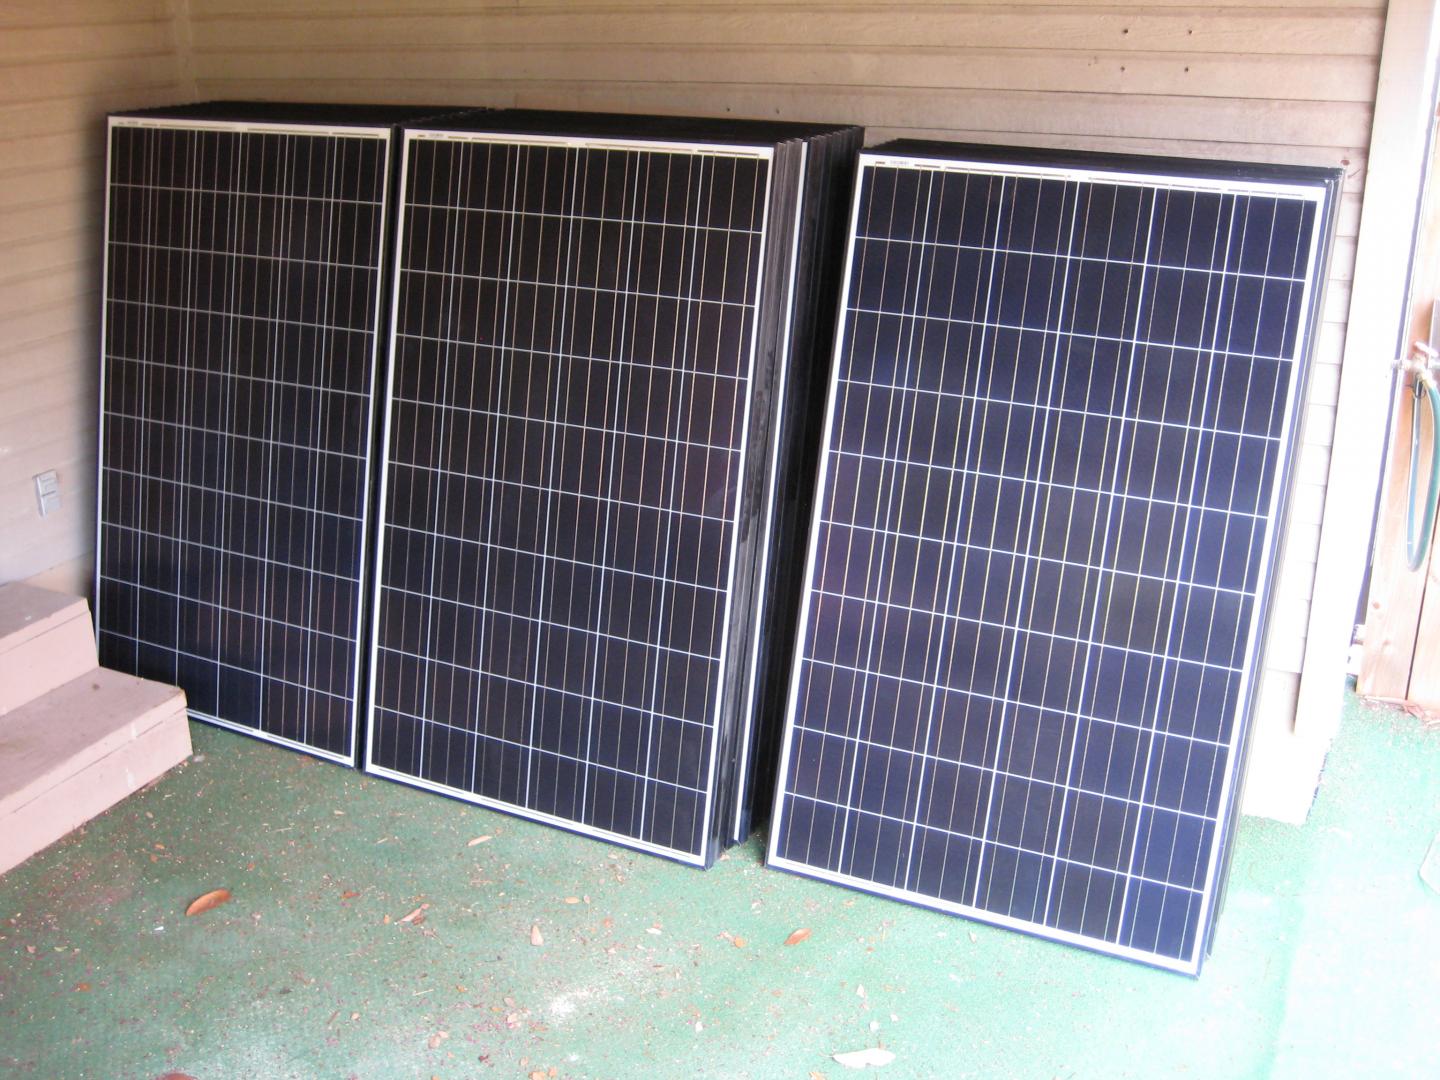
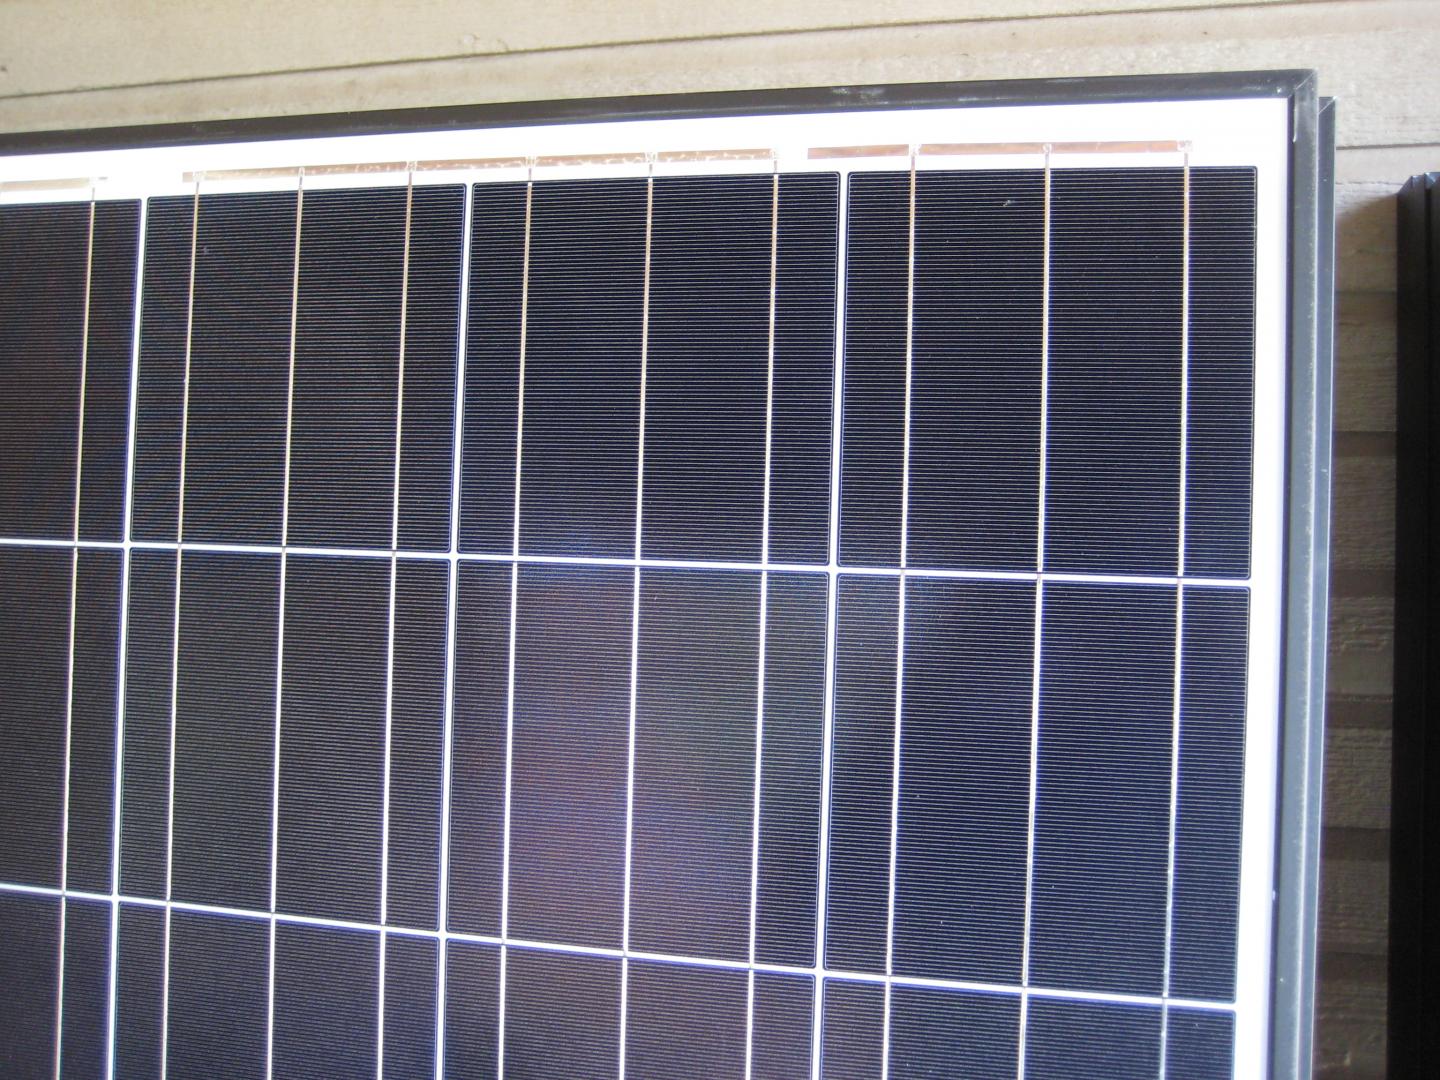
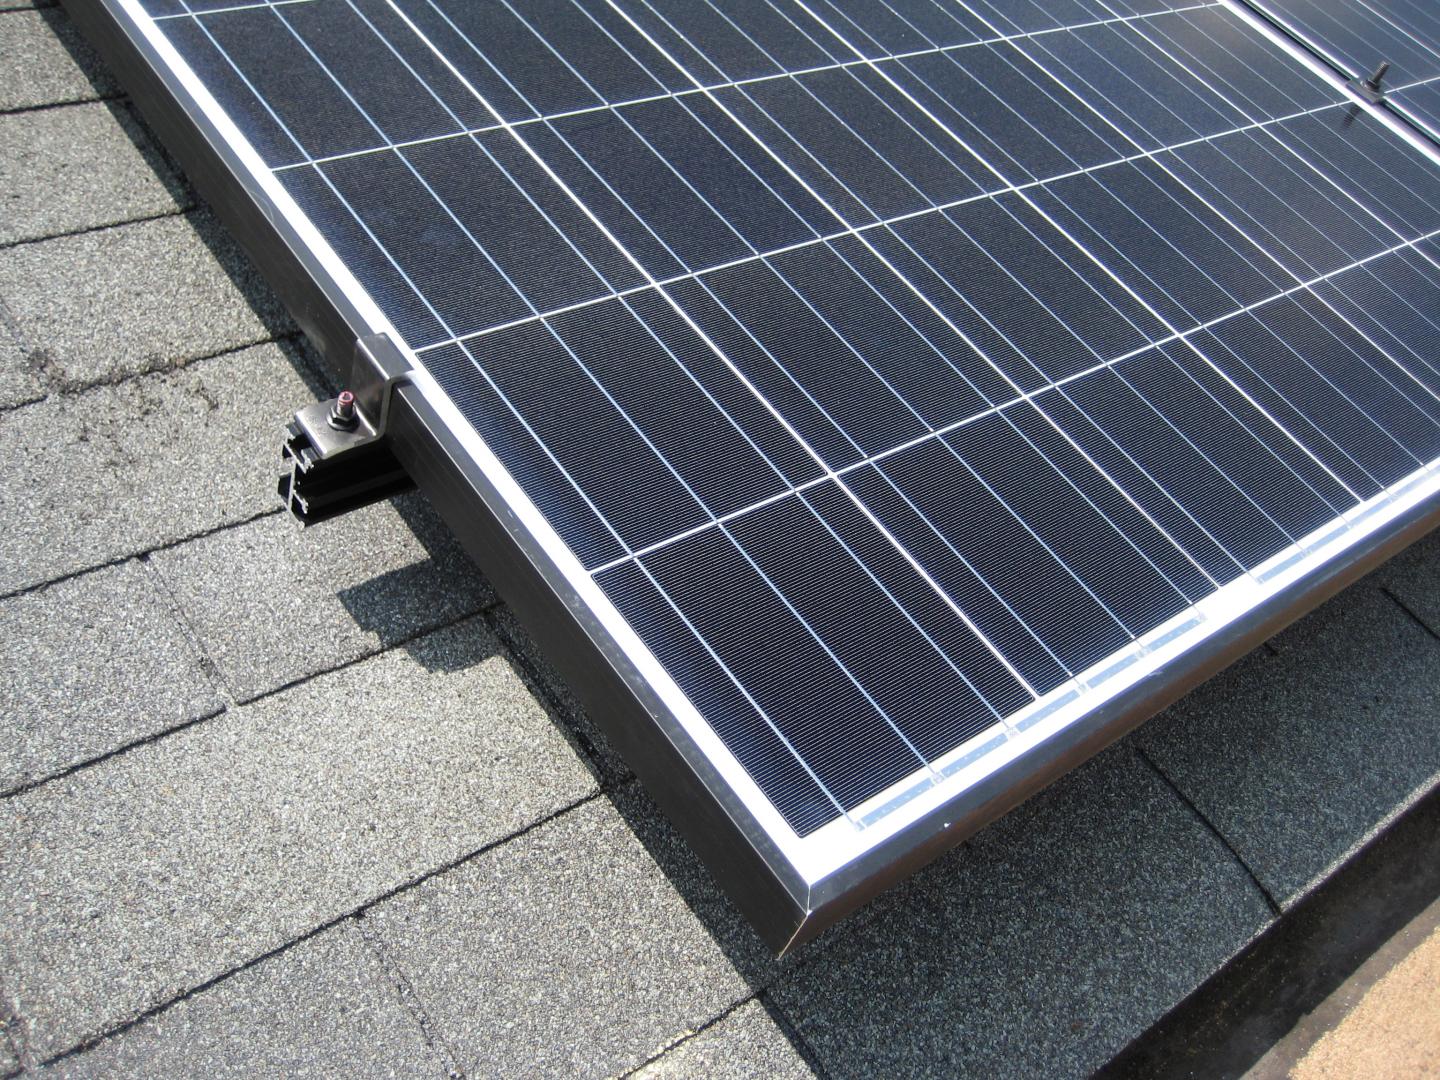
Each panel contains 60 monocrystalline cells soldered together behind a glass cover.
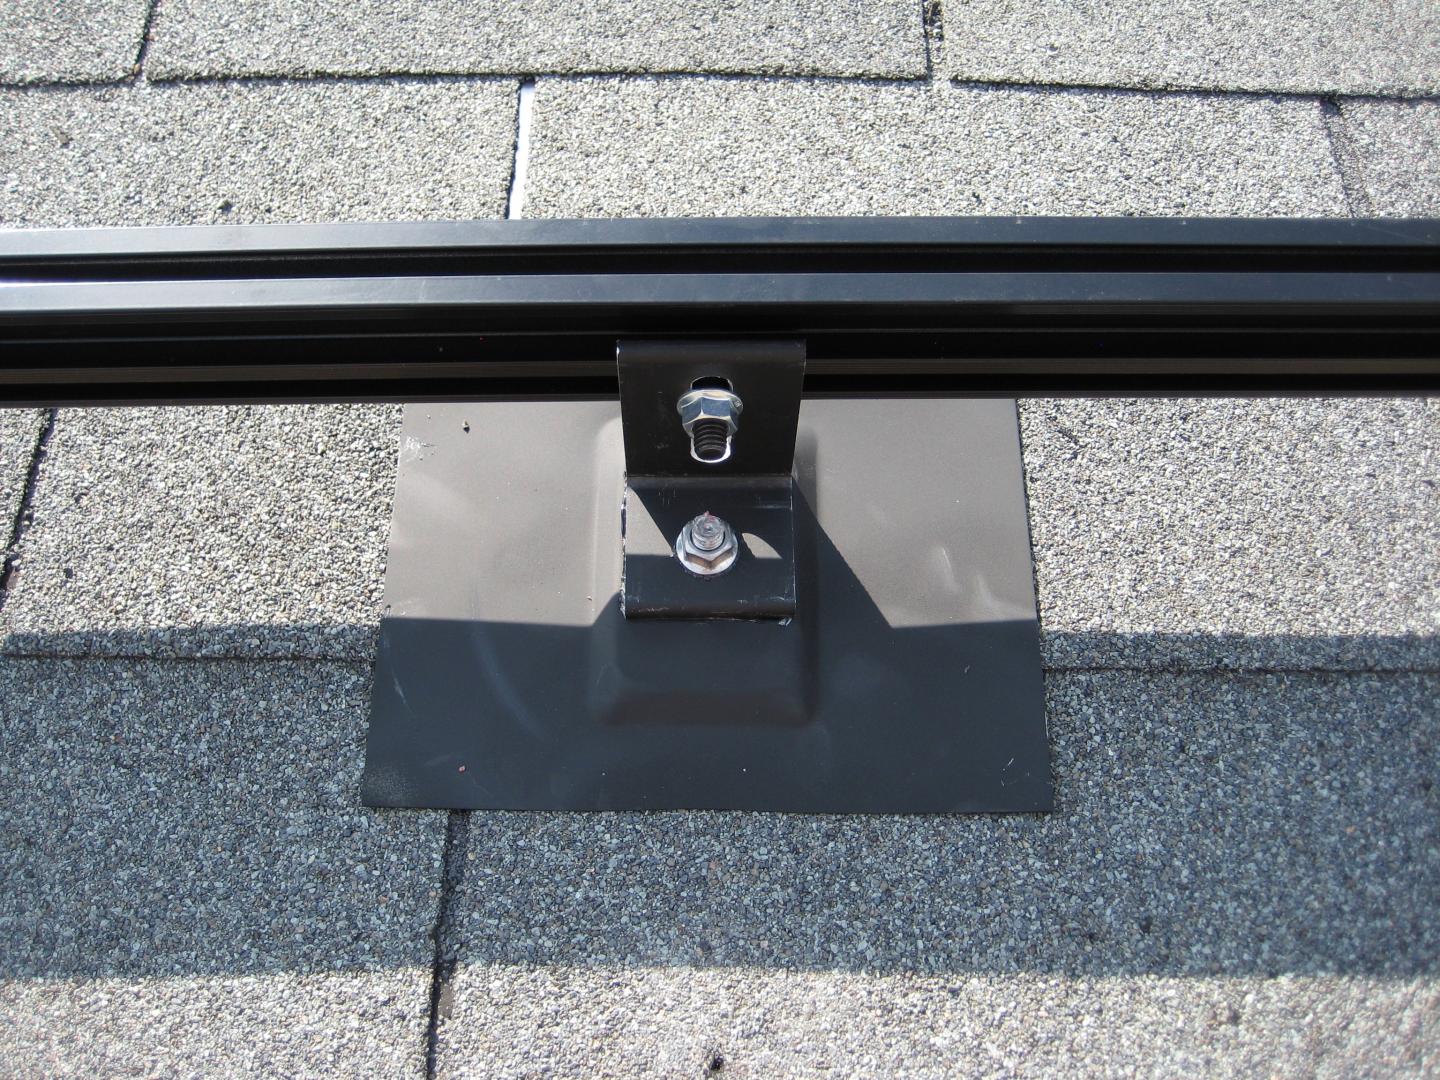
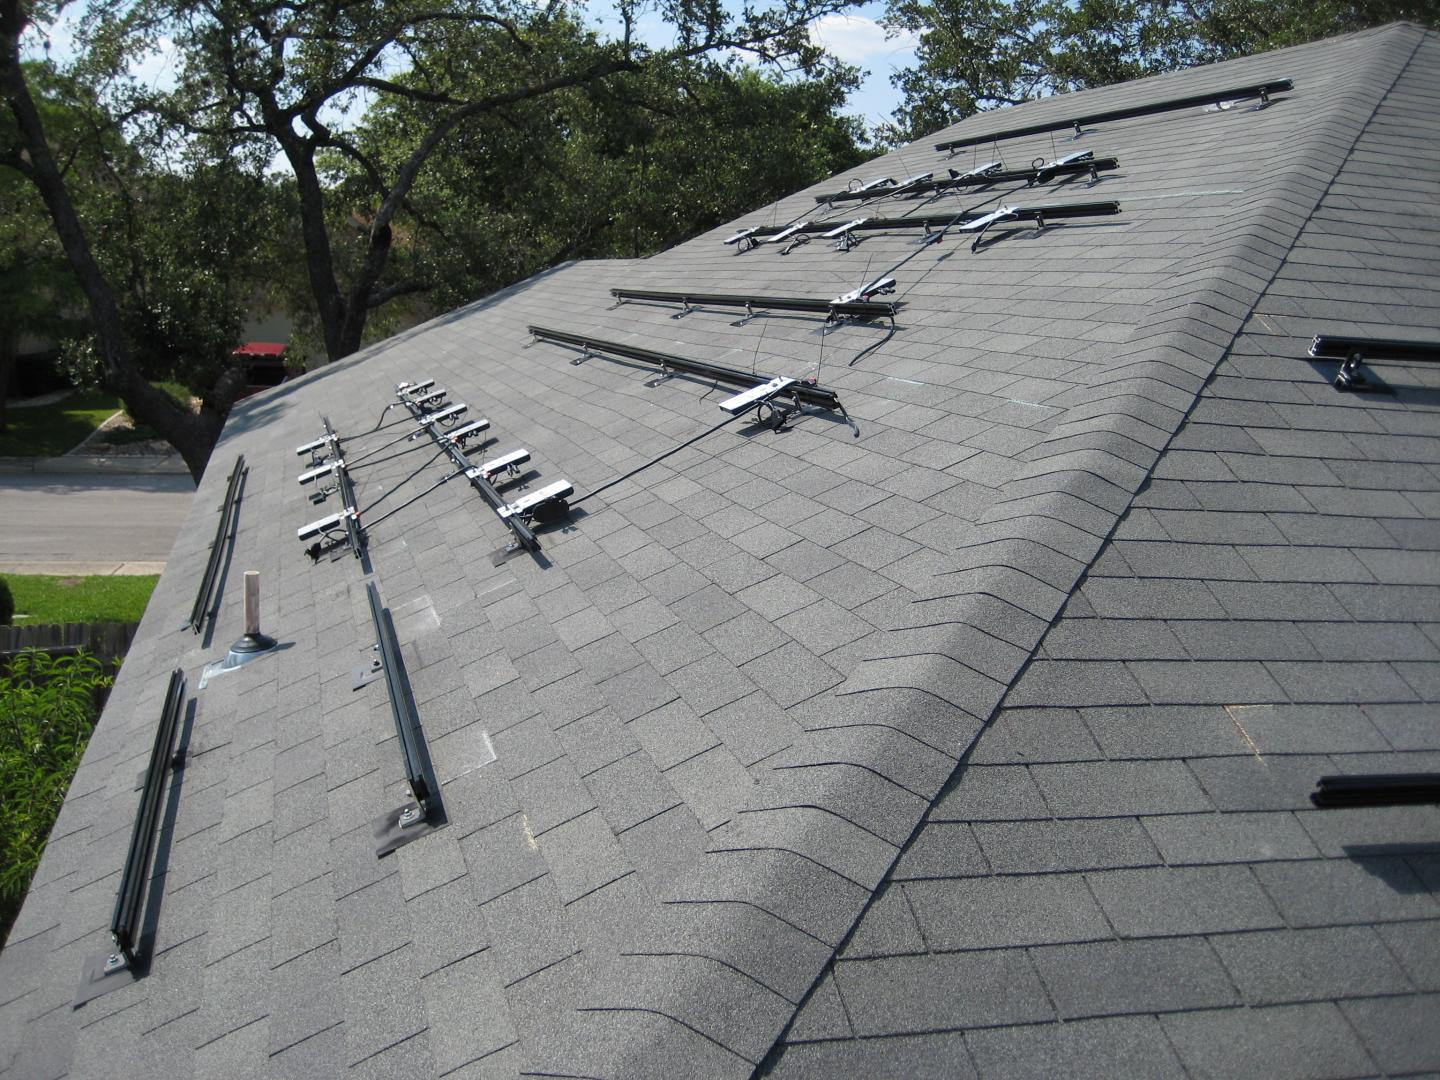
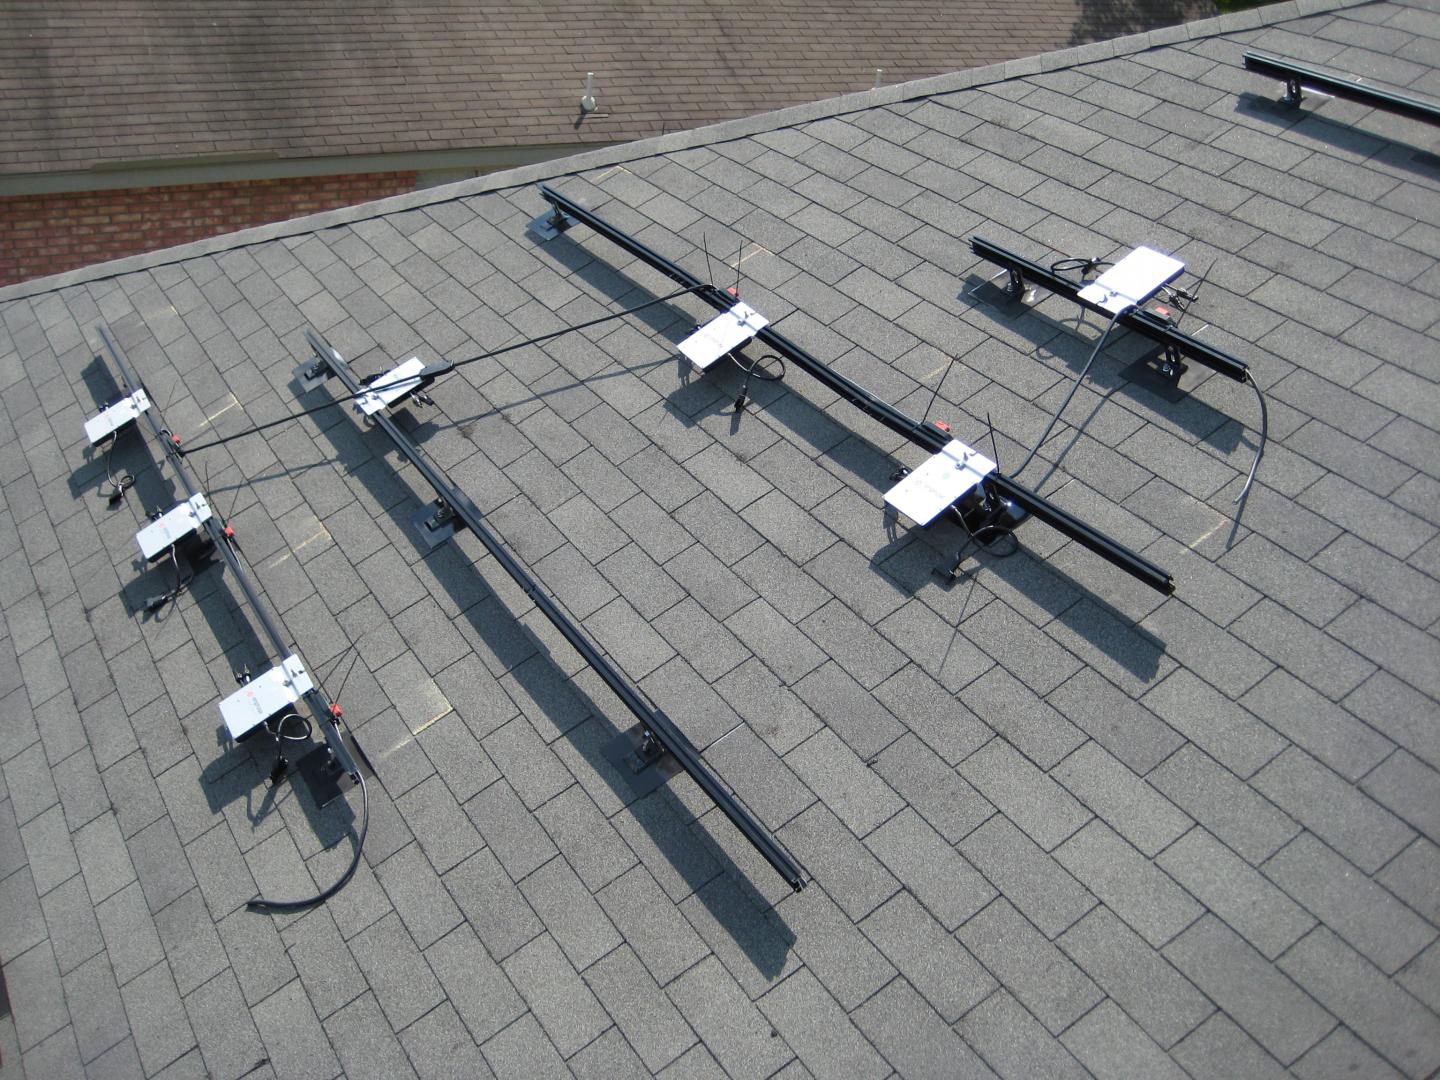
The panels bolt onto these aluminium tracks mounted on the roof.
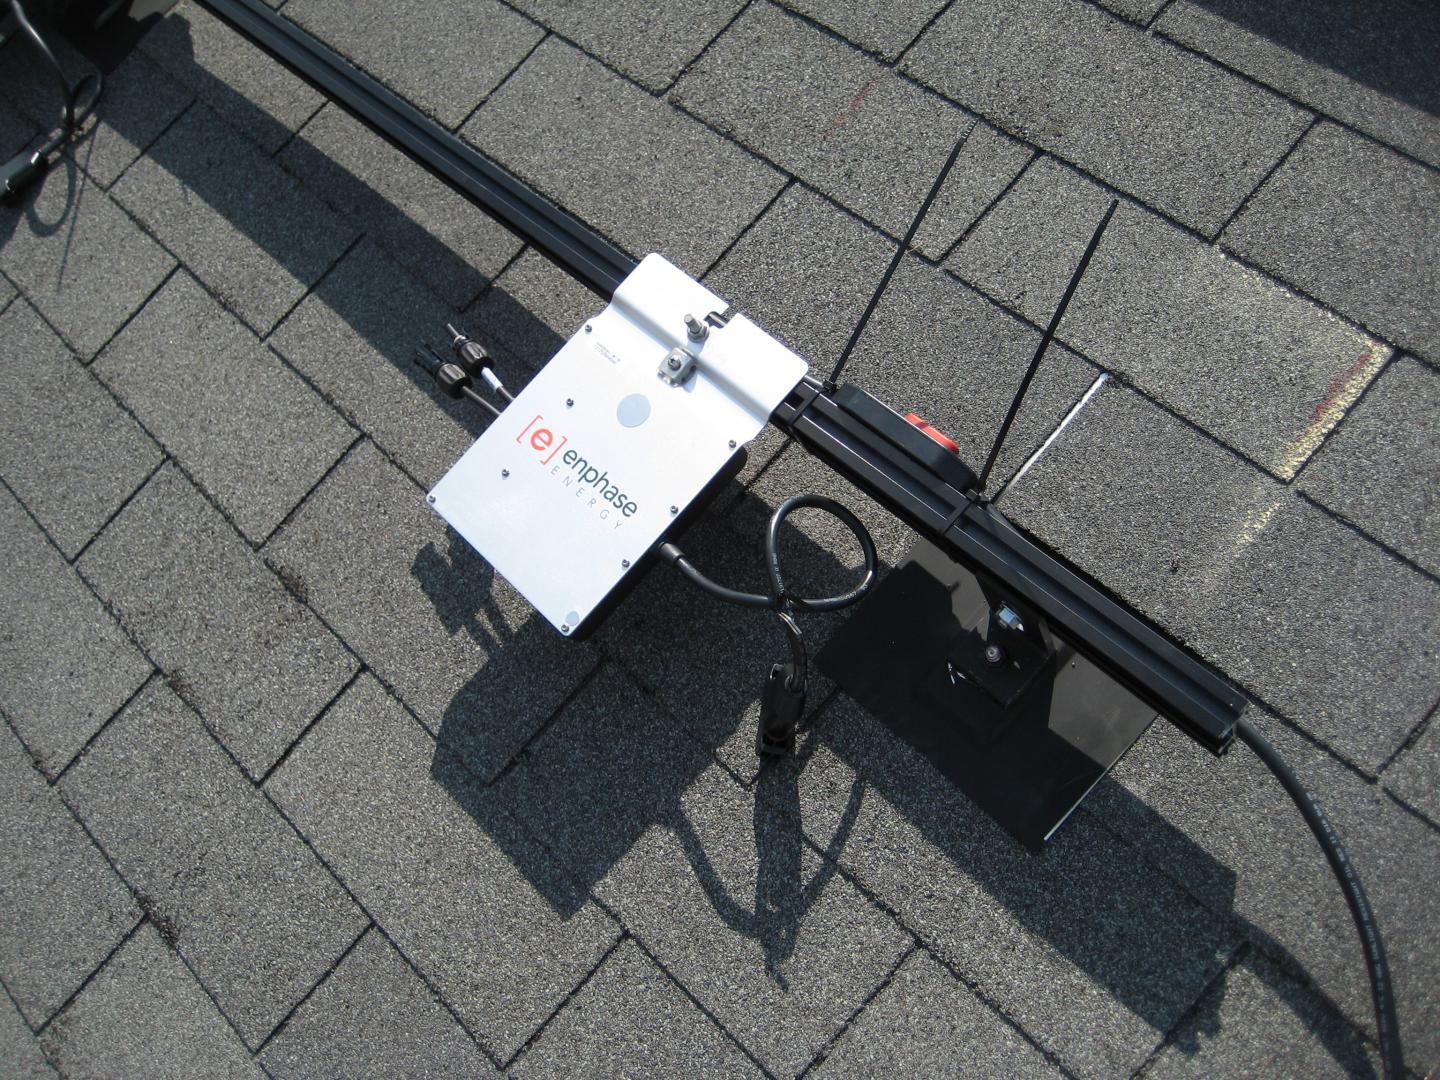
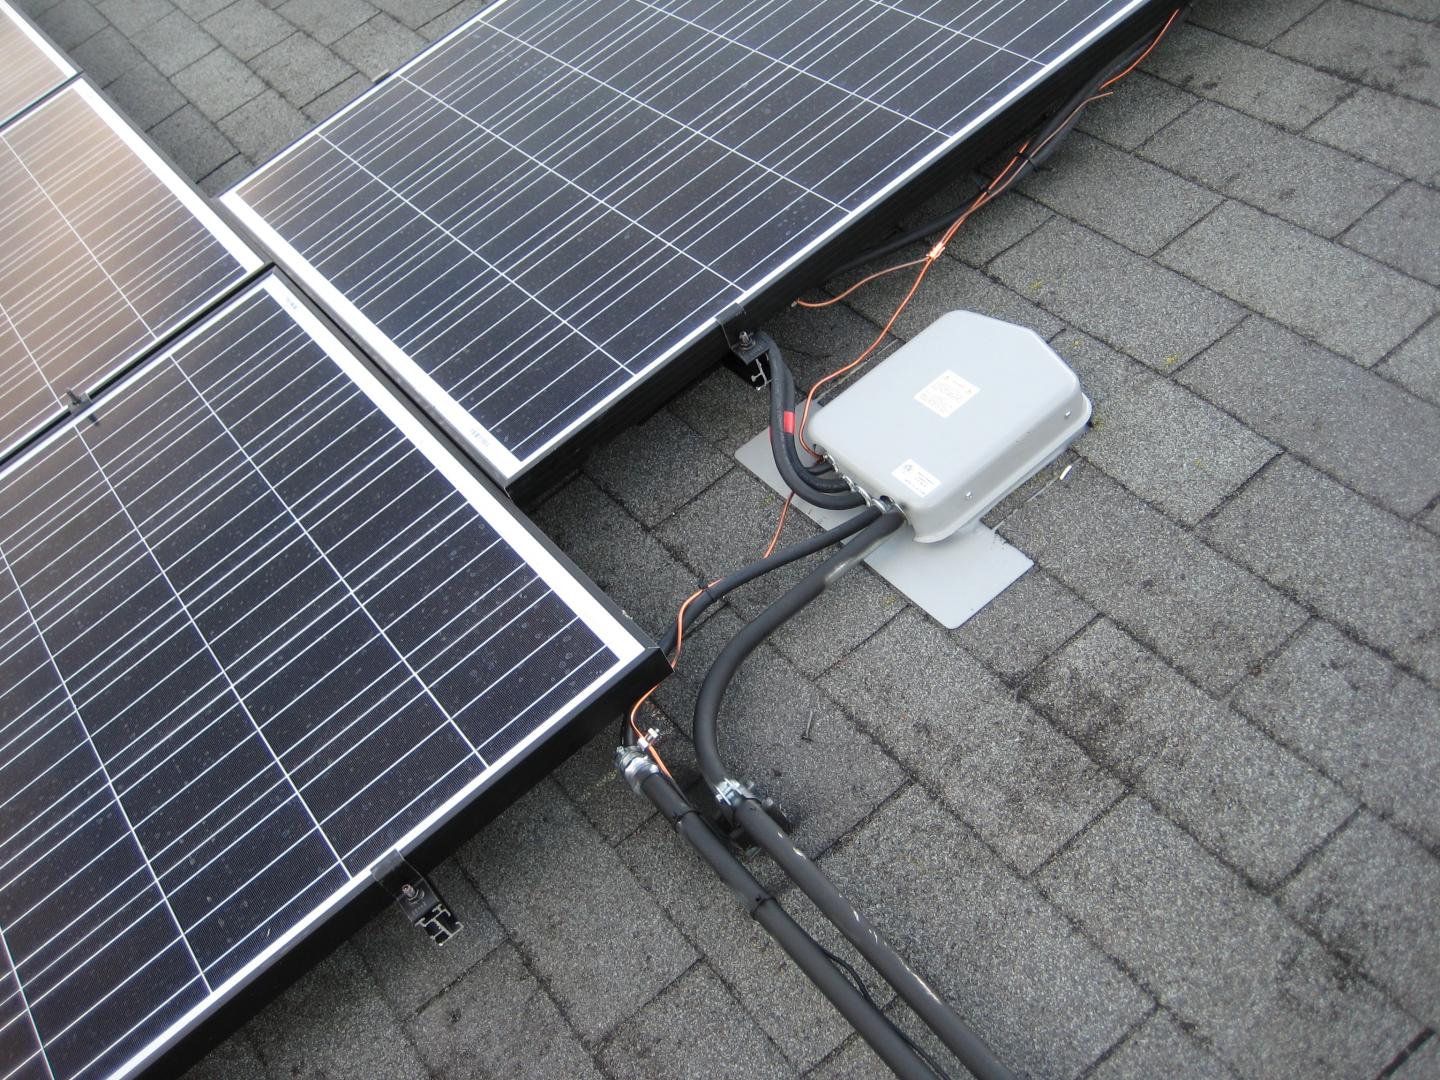
Behind each panel resides an micro-inverter that immediately converts the DC of the panel to the AC of the grid.
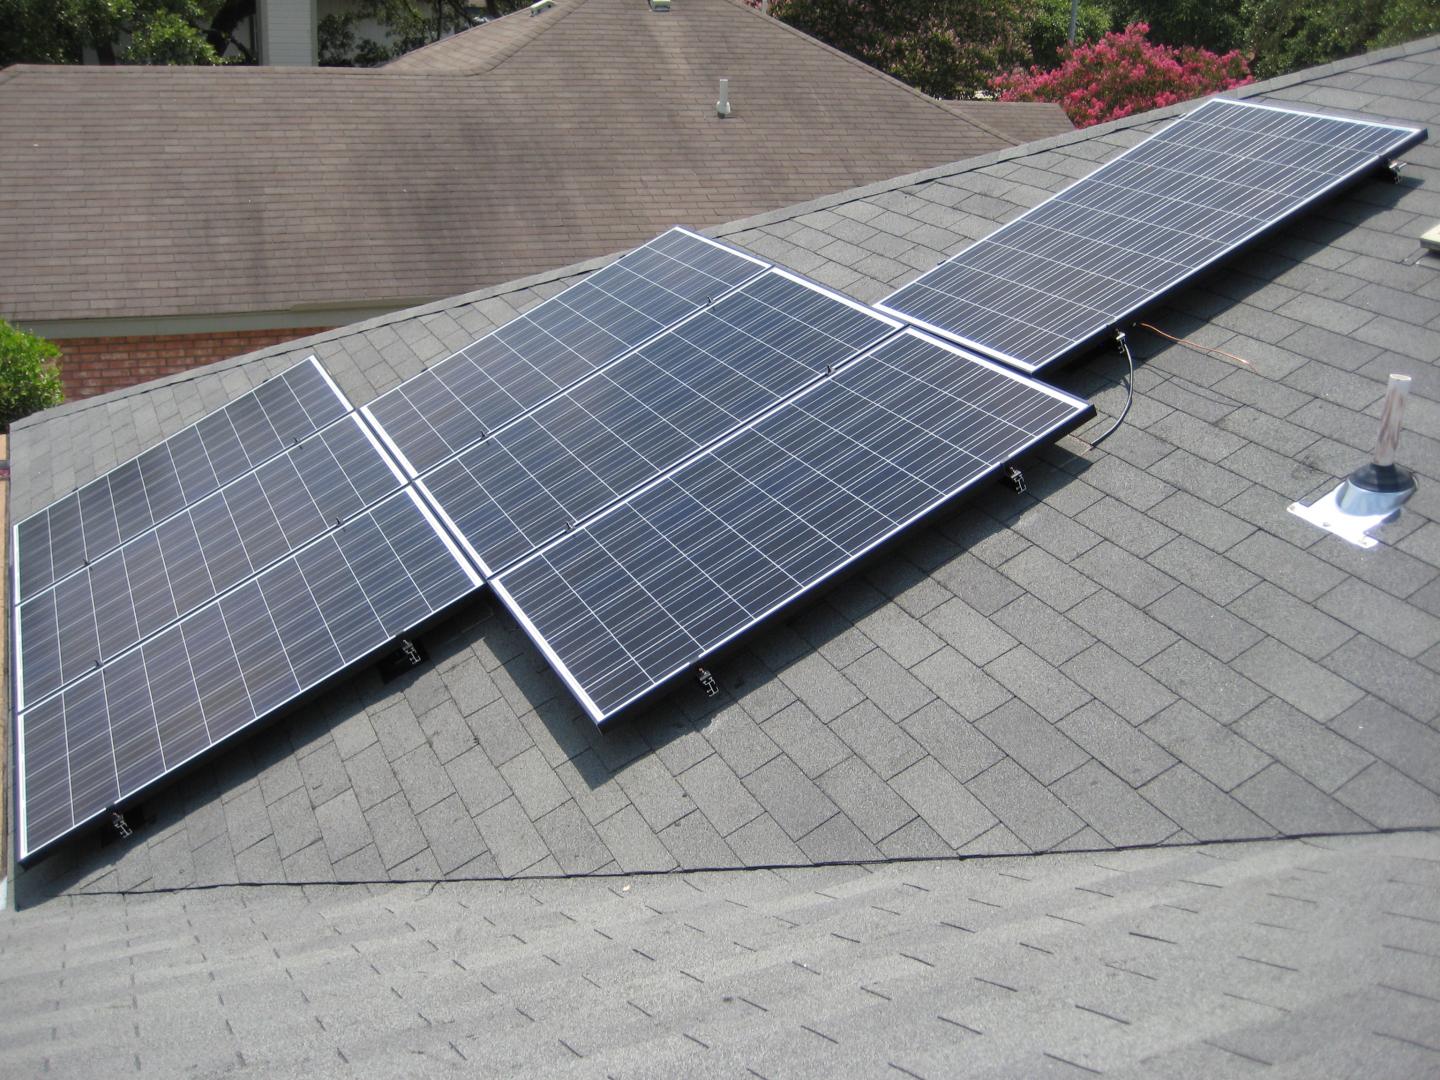
Most panels are on the south-west facing surface of the roof.
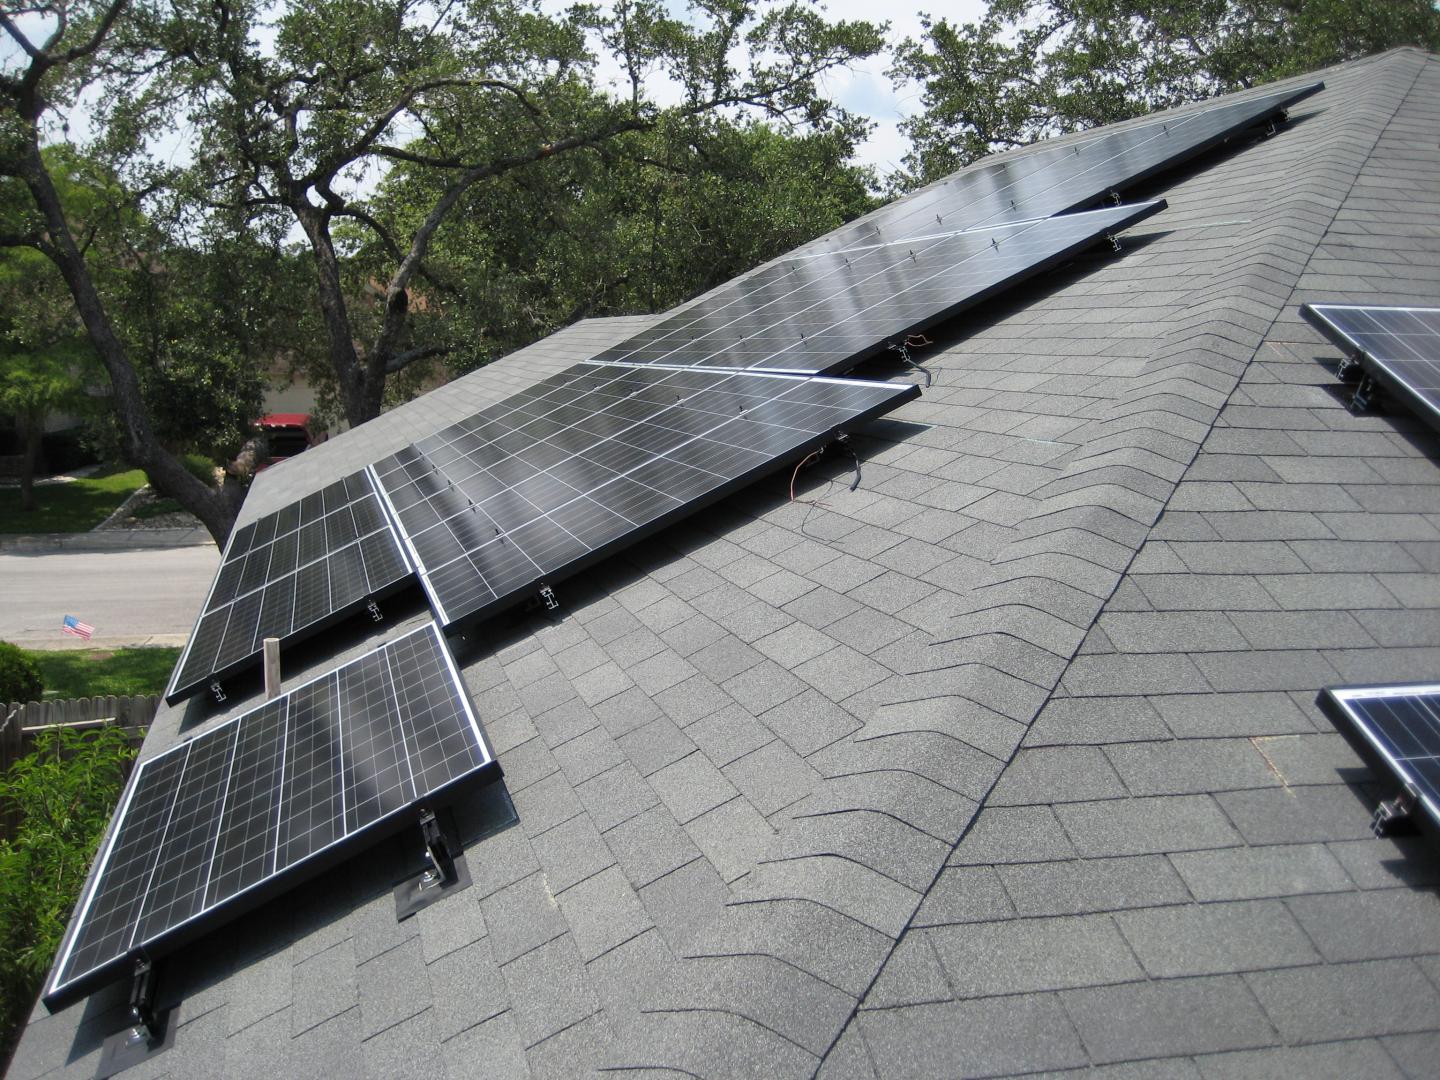
The middle and right sections face south-east.
Because the micro-inverters take care of the hard part, this simple junction box is all that is needed to tie the runs together.
Lots of boxes! On the top from left to right we have:
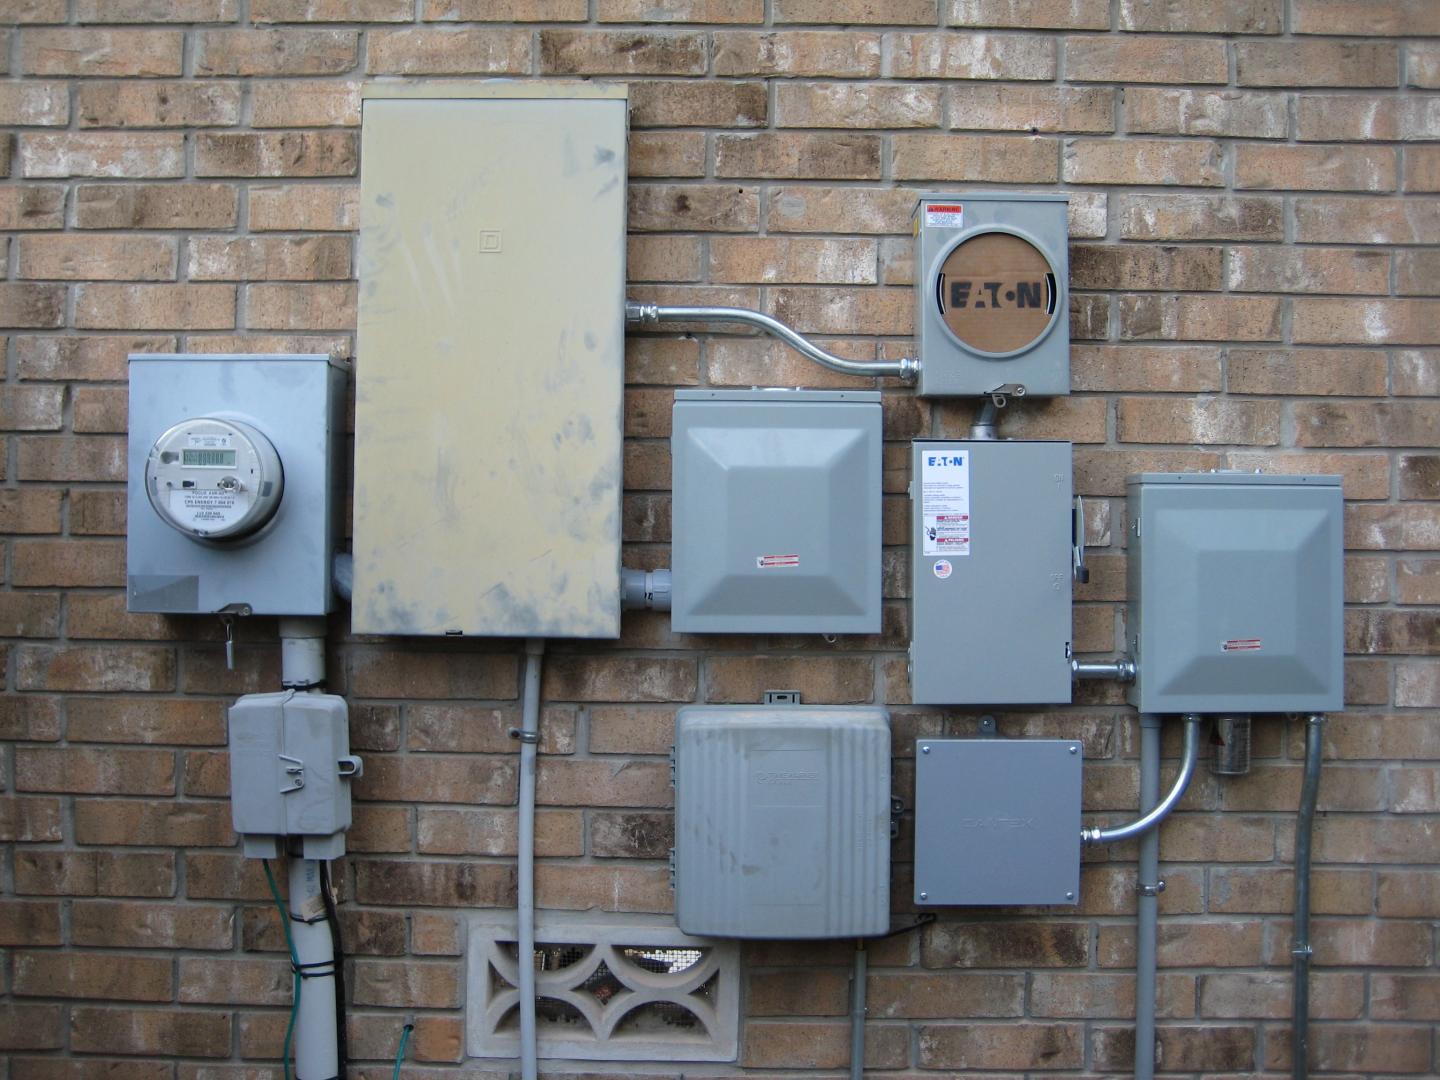
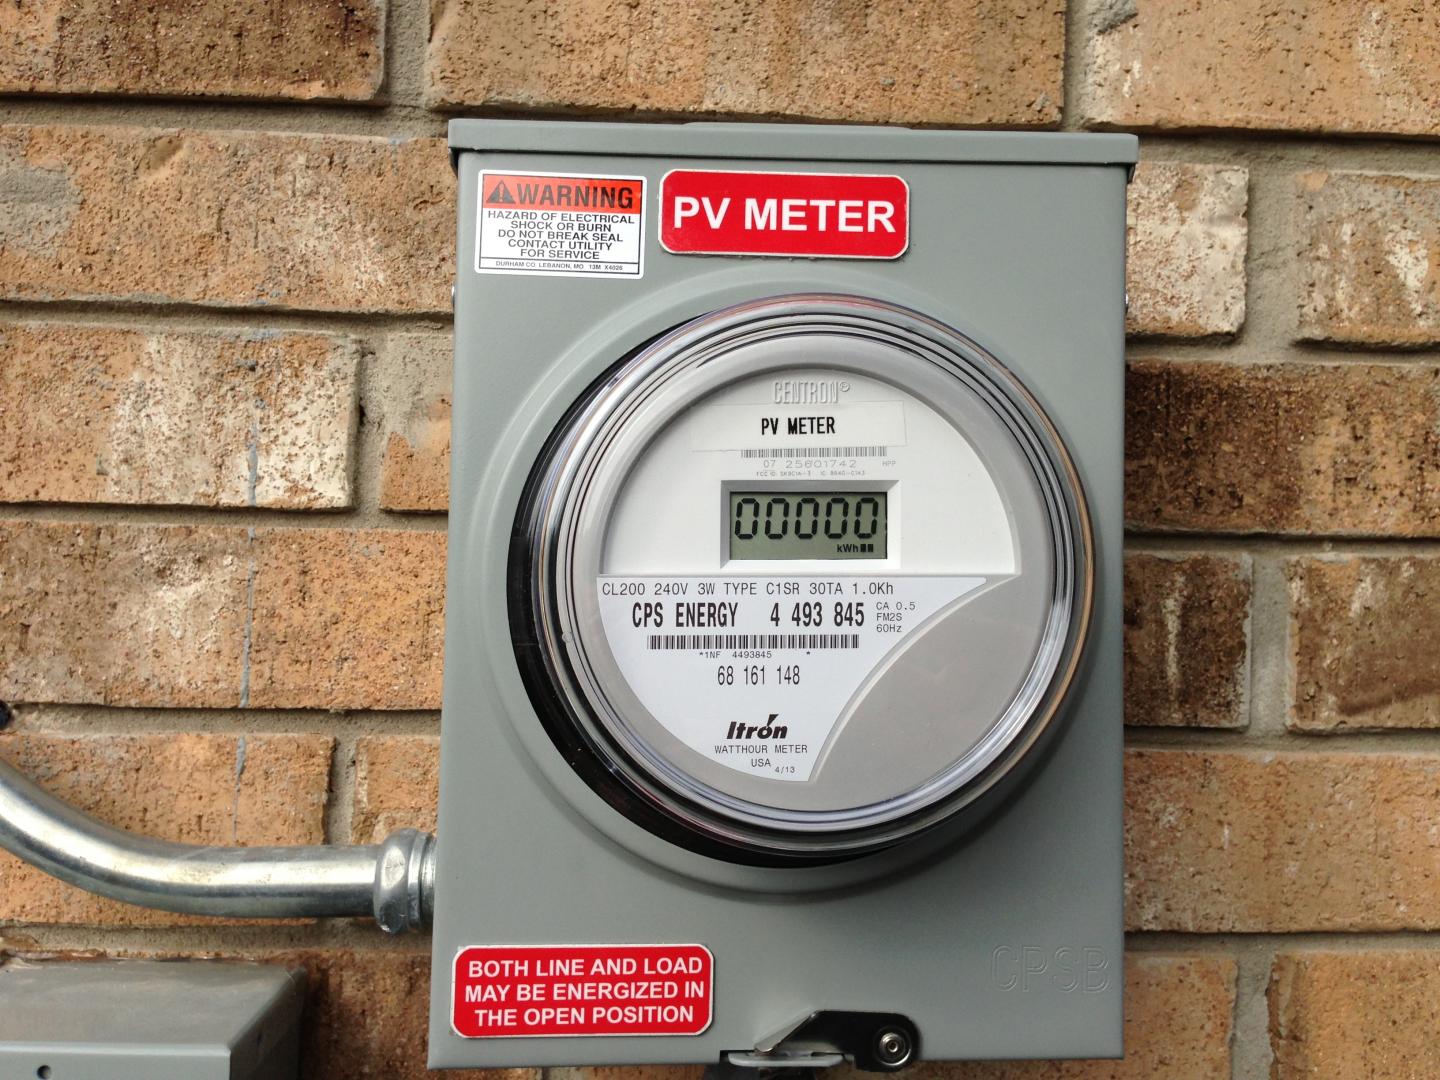
This is the PV meter. It simply counts how many kWh of electricity the solar system has produced.
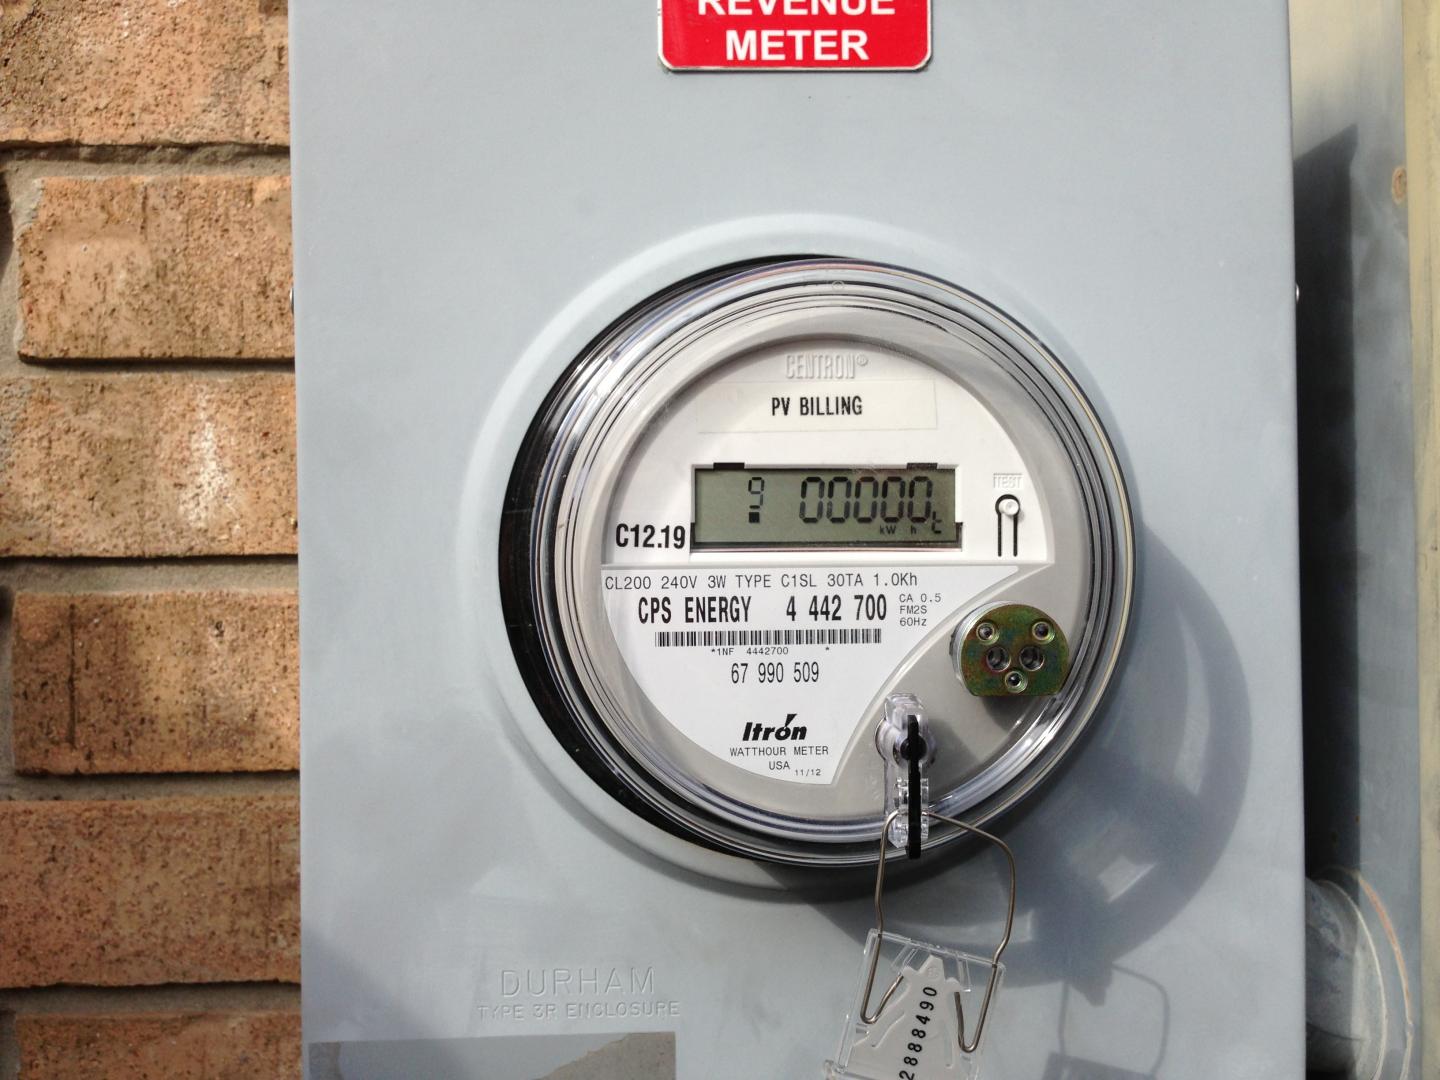
This is the revenue meter. It cycles between a number of counters. Although the display does have an animated "arrow" that moves backwards during the day, none of the counters are actually negative. The relevant counters are: "Total kWh delivered from the utility" and "Total excess kWh sent out to the utility."
Timeline
2013-05-03 Requested price quotes from several installers
2013-05-03 First phone and email contact with solar installers (CAM Solar)
2013-05-06 First installer to walk around on my roof and give suggestions (Longhorn Solar)
2013-05-07 Received first written price quote for solar system
2013-05-08 First survey and price quote for roof replacement
2013-05-09 Home Owners Association Approval
2013-05-10 Roof air vents removed, sewer vent rerouted to north surface
2013-05-11 Old roof removed and tar paper resurfaced
2013-05-12 New roof shingles installed (Day 1)
2013-05-13 New roof shingles installed (Day 2)
2013-05-14 Oak tree in the backyard cut down
2013-05-15 Oak trees in the front yard trimmed
2013-05-16 Signed contract with solar installer. Application documents sent to the power company.
2013-07-01 Power company finally approves solar application
2013-07-03 Received all solar panels, inverters, and racks. Racks mounted on the roof.
2013-07-04 Solar panels mounted on the roof
2013-07-09 Wires run and additional electrical boxes mounted to the wall
2013-07-30 Utility company swaps the old meter with the new PV meter and turns the system on! Internet monitoring system setup.
Overview
- 7.685 kW DC Power
- 29 Renesola 240 Watt Panels
- 29 Enphase Micro Inverters
- Enphase Envoy Gateway
- Gross System Cost: $29,946
- Utility and Installer Rebates: $16,895
- Federal Tax Credit: $3,915
- Net Cost: $9,136
All 29 panels in a stack.
Each panel contains 60 monocrystalline cells soldered together behind a glass cover.
The panels bolt onto these aluminium tracks mounted on the roof.
Behind each panel resides an micro-inverter that immediately converts the DC of the panel to the AC of the grid.
Most panels are on the south-west facing surface of the roof.
The middle and right sections face south-east.
Because the micro-inverters take care of the hard part, this simple junction box is all that is needed to tie the runs together.
Lots of boxes! On the top from left to right we have:
- Revenue meter
- Main breaker panel
- Sub breaker panel
- PV meter
- PV cutoff switch
- PV panel with lightning arrester
- ATT U-Verse box
- Time Warner Cable box
- Enphase Envoy box
This is the PV meter. It simply counts how many kWh of electricity the solar system has produced.
This is the revenue meter. It cycles between a number of counters. Although the display does have an animated "arrow" that moves backwards during the day, none of the counters are actually negative. The relevant counters are: "Total kWh delivered from the utility" and "Total excess kWh sent out to the utility."